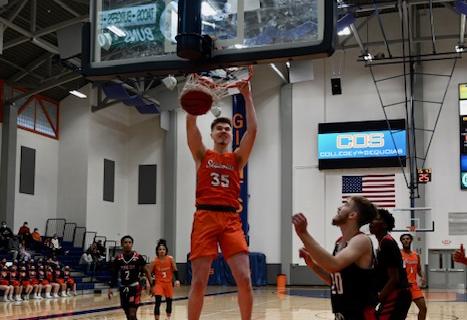
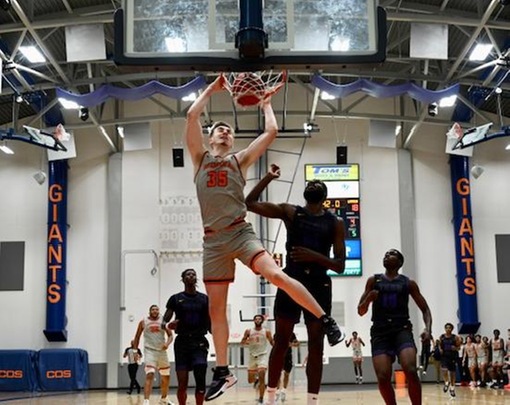
35 Scott Ator

-
- State:
- Texas
-
- Height:
- 6'8"
-
- Weight:
- 205
-
- Year:
- Sophomore
-
- Hometown:
- Murphy
-
- High School:
- Wylie
-
- Position:
- Forward
-
- gp
- 31
-
- pts/g
- 9.7
-
- fg %
- 56.7
-
- 3pt %
- 53.7
-
- ft %
- 69.4
-
- reb/g
- 6.1
-
- a/g
- 3.5
Recent Games
| Total | Conference | |
|---|---|---|
| Games | 31 | 14 |
| Games started | 29 | 14 |
| Minutes | 795 | 377 |
| Minutes per game | 25.6 | 26.9 |
| FG | 119-210 | 64-97 |
| FG Pct | 56.7 | 66.0 |
| 3PT | 29-54 | 20-30 |
| 3PT Pct | 53.7 | 66.7 |
| FT | 34-49 | 14-19 |
| FT Pct | 69.4 | 73.7 |
| Off rebounds | 68 | 26 |
| Def rebounds | 121 | 61 |
| Total rebounds | 189 | 87 |
| Rebounds per game | 6.1 | 6.2 |
| Personal fouls | 50 | 20 |
| Disqualifications | 1 | - |
| Assists | 107 | 60 |
| Turnovers | 46 | 23 |
| Assist to turnover ratio | 2.3 | 2.6 |
| Steals | 35 | 14 |
| Blocks | 67 | 38 |
| Points | 301 | 162 |
| Points per game | 9.7 | 11.6 |
| Points per 40 min | 15.1 | 17.2 |
Game Log - Shooting
| Date | Opponent | Score | gs | min | fg | pct | 3pt | pct | ft | pct | pts |
|---|---|---|---|---|---|---|---|---|---|---|---|
| Sep 17 | vs. TBA | - | - | - | - | - | - | - | - | - | |
| Sep 18 | vs. TBA | - | - | - | - | - | - | - | - | - | |
| Sep 19 | vs. TBA | - | - | - | - | - | - | - | - | - | |
| Oct 16 | Cabrillo | - | - | - | - | - | - | - | - | - | |
| Oct 23 | at West Valley | - | - | - | - | - | - | - | - | - | |
| Nov 4 | Palo Verde | L, 68-59 | 1 | 29 | 1-6 | 16.7 | 0-2 | 0.0 | 2-2 | 100.0 | 4 |
| Nov 5 | American River | W, 79-56 | 1 | 30 | 6-7 | 85.7 | 0-1 | 0.0 | 2-2 | 100.0 | 14 |
| Nov 12 | vs. Allan Hancock | W, 70-63 | 1 | 34 | 3-4 | 75.0 | 0-0 | - | 3-4 | 75.0 | 9 |
| Nov 13 | at Cuesta | W, 82-68 | - | 21 | 3-6 | 50.0 | 3-3 | 100.0 | 2-2 | 100.0 | 11 |
| Nov 23 | at Modesto | W, 81-72 | 1 | 26 | 7-15 | 46.7 | 1-1 | 100.0 | 0-0 | - | 15 |
| Dec 3 | vs. Ohlone | W, 113-65 | - | - | - | - | - | - | - | - | - |
| Dec 4 | at San Francisco | L, 80-66 | - | 24 | 3-12 | 25.0 | 0-2 | 0.0 | 4-4 | 100.0 | 10 |
| Dec 9 | vs. West LA | W, 70-66 | 1 | 24 | 2-9 | 22.2 | 1-5 | 20.0 | 2-2 | 100.0 | 7 |
| Dec 10 | vs. LA Southwest | W, 89-74 | 1 | 26 | 2-4 | 50.0 | 0-0 | - | 0-1 | 0.0 | 4 |
| Dec 11 | vs. San Diego City | W, 83-65 | 1 | 22 | 8-12 | 66.7 | 2-2 | 100.0 | 0-0 | - | 18 |
| Dec 17 | LA Trade Tech | W, 105-45 | 1 | 12 | 2-4 | 50.0 | 1-2 | 50.0 | 0-1 | 0.0 | 5 |
| Dec 18 | Ventura | W, 93-57 | 1 | 23 | 4-6 | 66.7 | 1-1 | 100.0 | 2-2 | 100.0 | 11 |
| Dec 30 | vs. MiraCosta | W, 73-70 | 1 | 8 | 0-1 | 0.0 | 0-0 | - | 0-0 | - | 0 |
| Dec 31 | vs. Antelope Valley | L, 65-57 | 1 | 26 | 2-4 | 50.0 | 0-0 | - | 0-2 | 0.0 | 4 |
| Jan 15 | at Porterville | W, 65-51 | 1 | 30 | 4-8 | 50.0 | 2-4 | 50.0 | 2-2 | 100.0 | 12 |
| Jan 17 | Merced | W, 82-72 | 1 | 19 | 4-7 | 57.1 | 0-1 | 0.0 | 0-0 | - | 8 |
| Jan 19 | at Columbia | L, 83-80 | 1 | 31 | 5-7 | 71.4 | 2-2 | 100.0 | 0-0 | - | 12 |
| Jan 22 | Porterville | W, 116-84 | 1 | 24 | 5-6 | 83.3 | 2-2 | 100.0 | 1-2 | 50.0 | 13 |
| Jan 24 | at West Hills Coalinga | W, 114-78 | 1 | 27 | 4-7 | 57.1 | 2-4 | 50.0 | 3-5 | 60.0 | 13 |
| Jan 26 | West Hills Lemoore | W, 89-72 | 1 | 30 | 9-10 | 90.0 | 5-6 | 83.3 | 0-0 | - | 23 |
| Jan 29 | West Hills Coalinga | W, 89-58 | 1 | 27 | 4-9 | 44.4 | 1-1 | 100.0 | 2-4 | 50.0 | 11 |
| Feb 2 | Fresno | W, 99-62 | 1 | 36 | 7-8 | 87.5 | 3-3 | 100.0 | 0-0 | - | 17 |
| Feb 5 | at Merced | W, 89-81 | 1 | 34 | 6-6 | 100.0 | 2-2 | 100.0 | 2-2 | 100.0 | 16 |
| Feb 7 | at Fresno | W, 86-63 | 1 | 24 | 3-5 | 60.0 | 0-1 | 0.0 | 2-2 | 100.0 | 8 |
| Feb 9 | Reedley | W, 103-55 | 1 | 23 | 3-5 | 60.0 | 0-1 | 0.0 | 0-0 | - | 6 |
| Feb 12 | Columbia | W, 75-54 | 1 | 28 | 4-8 | 50.0 | 0-1 | 0.0 | 0-0 | - | 8 |
| Feb 14 | at Reedley | W, 108-61 | 1 | 18 | 4-6 | 66.7 | 1-1 | 100.0 | 2-2 | 100.0 | 11 |
| Feb 18 | at West Hills Lemoore | W, 79-66 | 1 | 26 | 2-5 | 40.0 | 0-1 | 0.0 | 0-0 | - | 4 |
| Mar 3 | Redwoods | W, 88-64 | 1 | 31 | 2-9 | 22.2 | 0-3 | 0.0 | 0-0 | - | 4 |
| Mar 5 | Contra Costa | W, 91-82 | 1 | 27 | 6-8 | 75.0 | 0-2 | 0.0 | 3-6 | 50.0 | 15 |
| Mar 11 | vs. San Bernardino Valley | W, 69-62 | 1 | 26 | 3-5 | 60.0 | 0-0 | - | 0-2 | 0.0 | 6 |
| Mar 12 | vs. San Francisco | L, 71-65 | 1 | 29 | 1-1 | 100.0 | 0-0 | - | 0-0 | - | 2 |
Game Log - Ball control
| Date | Opponent | Score | gs | min | off | def | reb | ast | to | stl | blk |
|---|---|---|---|---|---|---|---|---|---|---|---|
| Sep 17 | vs. TBA | - | - | - | - | - | - | - | - | - | |
| Sep 18 | vs. TBA | - | - | - | - | - | - | - | - | - | |
| Sep 19 | vs. TBA | - | - | - | - | - | - | - | - | - | |
| Oct 16 | Cabrillo | - | - | - | - | - | - | - | - | - | |
| Oct 23 | at West Valley | - | - | - | - | - | - | - | - | - | |
| Nov 4 | Palo Verde | L, 68-59 | 1 | 29 | 4 | 3 | 7 | 1 | 2 | 3 | 2 |
| Nov 5 | American River | W, 79-56 | 1 | 30 | 3 | 3 | 6 | 3 | 3 | 0 | 2 |
| Nov 12 | vs. Allan Hancock | W, 70-63 | 1 | 34 | 4 | 4 | 8 | 3 | 0 | 1 | 3 |
| Nov 13 | at Cuesta | W, 82-68 | - | 21 | 1 | 2 | 3 | 2 | 3 | 4 | 2 |
| Nov 23 | at Modesto | W, 81-72 | 1 | 26 | 4 | 3 | 7 | 4 | 0 | 1 | 3 |
| Dec 3 | vs. Ohlone | W, 113-65 | - | - | - | - | - | - | - | - | - |
| Dec 4 | at San Francisco | L, 80-66 | - | 24 | 3 | 3 | 6 | 2 | 1 | 1 | 2 |
| Dec 9 | vs. West LA | W, 70-66 | 1 | 24 | 2 | 5 | 7 | 6 | 3 | 2 | 4 |
| Dec 10 | vs. LA Southwest | W, 89-74 | 1 | 26 | 1 | 4 | 5 | 4 | 0 | 2 | 0 |
| Dec 11 | vs. San Diego City | W, 83-65 | 1 | 22 | 4 | 5 | 9 | 1 | 2 | 1 | 1 |
| Dec 17 | LA Trade Tech | W, 105-45 | 1 | 12 | 0 | 3 | 3 | 1 | 0 | 0 | 0 |
| Dec 18 | Ventura | W, 93-57 | 1 | 23 | 4 | 2 | 6 | 7 | 2 | 2 | 3 |
| Dec 30 | vs. MiraCosta | W, 73-70 | 1 | 8 | 0 | 2 | 2 | 3 | 1 | 0 | 0 |
| Dec 31 | vs. Antelope Valley | L, 65-57 | 1 | 26 | 2 | 4 | 6 | 1 | 2 | 0 | 2 |
| Jan 15 | at Porterville | W, 65-51 | 1 | 30 | 2 | 5 | 7 | 0 | 2 | 1 | 6 |
| Jan 17 | Merced | W, 82-72 | 1 | 19 | 4 | 0 | 4 | 2 | 1 | 1 | 0 |
| Jan 19 | at Columbia | L, 83-80 | 1 | 31 | 0 | 4 | 4 | 4 | 3 | 2 | 1 |
| Jan 22 | Porterville | W, 116-84 | 1 | 24 | 1 | 7 | 8 | 4 | 1 | 1 | 7 |
| Jan 24 | at West Hills Coalinga | W, 114-78 | 1 | 27 | 3 | 1 | 4 | 5 | 1 | 2 | 3 |
| Jan 26 | West Hills Lemoore | W, 89-72 | 1 | 30 | 2 | 1 | 3 | 7 | 1 | 2 | 1 |
| Jan 29 | West Hills Coalinga | W, 89-58 | 1 | 27 | 3 | 5 | 8 | 2 | 2 | 1 | 2 |
| Feb 2 | Fresno | W, 99-62 | 1 | 36 | 0 | 8 | 8 | 4 | 0 | 0 | 3 |
| Feb 5 | at Merced | W, 89-81 | 1 | 34 | 2 | 12 | 14 | 4 | 2 | 0 | 2 |
| Feb 7 | at Fresno | W, 86-63 | 1 | 24 | 2 | 4 | 6 | 4 | 1 | 1 | 2 |
| Feb 9 | Reedley | W, 103-55 | 1 | 23 | 1 | 3 | 4 | 9 | 0 | 1 | 3 |
| Feb 12 | Columbia | W, 75-54 | 1 | 28 | 3 | 7 | 10 | 6 | 5 | 1 | 3 |
| Feb 14 | at Reedley | W, 108-61 | 1 | 18 | 2 | 2 | 4 | 4 | 1 | 0 | 1 |
| Feb 18 | at West Hills Lemoore | W, 79-66 | 1 | 26 | 1 | 2 | 3 | 5 | 3 | 1 | 4 |
| Mar 3 | Redwoods | W, 88-64 | 1 | 31 | 4 | 5 | 9 | 5 | 2 | 3 | 1 |
| Mar 5 | Contra Costa | W, 91-82 | 1 | 27 | 1 | 5 | 6 | 1 | 0 | 1 | 1 |
| Mar 11 | vs. San Bernardino Valley | W, 69-62 | 1 | 26 | 4 | 5 | 9 | 2 | 2 | 0 | 3 |
| Mar 12 | vs. San Francisco | L, 71-65 | 1 | 29 | 1 | 2 | 3 | 1 | 0 | 0 | 0 |
Game Log - Ball control extended
| Date | Opponent | Score | gs | pf | dq | a/to |
|---|---|---|---|---|---|---|
| Sep 17 | vs. TBA | - | - | - | - | |
| Sep 18 | vs. TBA | - | - | - | - | |
| Sep 19 | vs. TBA | - | - | - | - | |
| Oct 16 | Cabrillo | - | - | - | - | |
| Oct 23 | at West Valley | - | - | - | - | |
| Nov 4 | Palo Verde | L, 68-59 | 1 | 5 | 1 | 0.5 |
| Nov 5 | American River | W, 79-56 | 1 | 2 | - | 1.0 |
| Nov 12 | vs. Allan Hancock | W, 70-63 | 1 | 2 | - | - |
| Nov 13 | at Cuesta | W, 82-68 | - | 3 | - | 0.7 |
| Nov 23 | at Modesto | W, 81-72 | 1 | 2 | - | - |
| Dec 3 | vs. Ohlone | W, 113-65 | - | - | - | - |
| Dec 4 | at San Francisco | L, 80-66 | - | 1 | - | 2.0 |
| Dec 9 | vs. West LA | W, 70-66 | 1 | 0 | - | 2.0 |
| Dec 10 | vs. LA Southwest | W, 89-74 | 1 | 4 | - | - |
| Dec 11 | vs. San Diego City | W, 83-65 | 1 | 4 | - | 0.5 |
| Dec 17 | LA Trade Tech | W, 105-45 | 1 | 1 | - | - |
| Dec 18 | Ventura | W, 93-57 | 1 | 1 | - | 3.5 |
| Dec 30 | vs. MiraCosta | W, 73-70 | 1 | 0 | - | 3.0 |
| Dec 31 | vs. Antelope Valley | L, 65-57 | 1 | 3 | - | 0.5 |
| Jan 15 | at Porterville | W, 65-51 | 1 | 1 | - | 0.0 |
| Jan 17 | Merced | W, 82-72 | 1 | 1 | - | 2.0 |
| Jan 19 | at Columbia | L, 83-80 | 1 | 1 | - | 1.3 |
| Jan 22 | Porterville | W, 116-84 | 1 | 1 | - | 4.0 |
| Jan 24 | at West Hills Coalinga | W, 114-78 | 1 | 1 | - | 5.0 |
| Jan 26 | West Hills Lemoore | W, 89-72 | 1 | 0 | - | 7.0 |
| Jan 29 | West Hills Coalinga | W, 89-58 | 1 | 2 | - | 1.0 |
| Feb 2 | Fresno | W, 99-62 | 1 | 2 | - | - |
| Feb 5 | at Merced | W, 89-81 | 1 | 3 | - | 2.0 |
| Feb 7 | at Fresno | W, 86-63 | 1 | 3 | - | 4.0 |
| Feb 9 | Reedley | W, 103-55 | 1 | 1 | - | - |
| Feb 12 | Columbia | W, 75-54 | 1 | 2 | - | 1.2 |
| Feb 14 | at Reedley | W, 108-61 | 1 | 0 | - | 4.0 |
| Feb 18 | at West Hills Lemoore | W, 79-66 | 1 | 2 | - | 1.7 |
| Mar 3 | Redwoods | W, 88-64 | 1 | 0 | - | 2.5 |
| Mar 5 | Contra Costa | W, 91-82 | 1 | 1 | - | - |
| Mar 11 | vs. San Bernardino Valley | W, 69-62 | 1 | 1 | - | 1.0 |
| Mar 12 | vs. San Francisco | L, 71-65 | 1 | 0 | - | - |
Splits Stats - Shooting per game
| gp | min/g | fg/g | 3pt/g | ft/g | ppg | |
|---|---|---|---|---|---|---|
| Event | ||||||
| Total | 31 | 25.6 | 3.8-6.8 | 0.9-1.7 | 1.1-1.6 | 9.7 |
| Conference | 14 | 26.9 | 4.6-6.9 | 1.4-2.1 | 1.0-1.4 | 11.6 |
| Exhibition | - | - | 0.0-0.0 | 0.0-0.0 | 0.0-0.0 | - |
| Location | ||||||
| Home | 13 | 26.1 | 4.4-7.2 | 1.0-2.0 | 0.9-1.5 | 10.7 |
| Away | 10 | 26.1 | 4.1-7.7 | 1.3-2.1 | 1.7-1.9 | 11.2 |
| Neutral | 8 | 24.4 | 2.6-5.0 | 0.4-0.9 | 0.6-1.4 | 6.3 |
| Result | ||||||
| Wins | 26 | 25.2 | 4.1-6.9 | 1.0-1.8 | 1.1-1.6 | 10.3 |
| Losses | 5 | 27.8 | 2.4-6.0 | 0.4-1.2 | 1.2-1.6 | 6.4 |
| Month | ||||||
| November | 5 | 28.0 | 4.0-7.6 | 0.8-1.4 | 1.8-2.0 | 10.6 |
| December | 8 | 20.6 | 2.9-6.5 | 0.6-1.5 | 1.0-1.5 | 7.4 |
| January | 7 | 26.9 | 5.0-7.7 | 2.0-2.9 | 1.1-1.9 | 13.1 |
| February | 7 | 27.0 | 4.1-6.1 | 0.9-1.4 | 0.9-0.9 | 10.0 |
| March | 4 | 28.3 | 3.0-5.8 | 0.0-1.2 | 0.8-2.0 | 6.8 |
Splits Stats - Shooting totals
| gp | gs | min | fg | pct | 3pt | pct | ft | pct | pts | |
|---|---|---|---|---|---|---|---|---|---|---|
| Event | ||||||||||
| Total | 31 | 29 | 795 | 119-210 | 56.7 | 29-54 | 53.7 | 34-49 | 69.4 | 301 |
| Conference | 14 | 14 | 377 | 64-97 | 66.0 | 20-30 | 66.7 | 14-19 | 73.7 | 162 |
| Exhibition | - | - | - | 0-0 | - | 0-0 | - | 0-0 | - | 0 |
| Location | ||||||||||
| Home | 13 | 13 | 339 | 57-93 | 61.3 | 13-26 | 50.0 | 12-19 | 63.2 | 139 |
| Away | 10 | 8 | 261 | 41-77 | 53.2 | 13-21 | 61.9 | 17-19 | 89.5 | 112 |
| Neutral | 8 | 8 | 195 | 21-40 | 52.5 | 3-7 | 42.9 | 5-11 | 45.5 | 50 |
| Result | ||||||||||
| Wins | 26 | 25 | 656 | 107-180 | 59.4 | 27-48 | 56.3 | 28-41 | 68.3 | 269 |
| Losses | 5 | 4 | 139 | 12-30 | 40.0 | 2-6 | 33.3 | 6-8 | 75.0 | 32 |
| Month | ||||||||||
| November | 5 | 4 | 140 | 20-38 | 52.6 | 4-7 | 57.1 | 9-10 | 90.0 | 53 |
| December | 8 | 7 | 165 | 23-52 | 44.2 | 5-12 | 41.7 | 8-12 | 66.7 | 59 |
| January | 7 | 7 | 188 | 35-54 | 64.8 | 14-20 | 70.0 | 8-13 | 61.5 | 92 |
| February | 7 | 7 | 189 | 29-43 | 67.4 | 6-10 | 60.0 | 6-6 | 100.0 | 70 |
| March | 4 | 4 | 113 | 12-23 | 52.2 | 0-5 | 0.0 | 3-8 | 37.5 | 27 |
Splits Stats - Shooting per 40 min
| gp | min | min/g | fg/40 | 3pt/40 | pct | ft/40 | pts/40 | |
|---|---|---|---|---|---|---|---|---|
| Event | ||||||||
| Total | 31 | 795 | 25.6 | 6.0-10.6 | 1.5-2.7 | 53.7 | 1.7-2.5 | 15.1 |
| Conference | 14 | 377 | 26.9 | 6.8-10.3 | 2.1-3.2 | 66.7 | 1.5-2.0 | 17.2 |
| Exhibition | - | - | - | 0.0-0.0 | 0.0-0.0 | - | 0.0-0.0 | - |
| Location | ||||||||
| Home | 13 | 339 | 26.1 | 6.7-11.0 | 1.5-3.1 | 50.0 | 1.4-2.2 | 16.4 |
| Away | 10 | 261 | 26.1 | 6.3-11.8 | 2.0-3.2 | 61.9 | 2.6-2.9 | 17.2 |
| Neutral | 8 | 195 | 24.4 | 4.3-8.2 | 0.6-1.4 | 42.9 | 1.0-2.3 | 10.3 |
| Result | ||||||||
| Wins | 26 | 656 | 25.2 | 6.5-11.0 | 1.6-2.9 | 56.3 | 1.7-2.5 | 16.4 |
| Losses | 5 | 139 | 27.8 | 3.5-8.6 | 0.6-1.7 | 33.3 | 1.7-2.3 | 9.2 |
| Month | ||||||||
| November | 5 | 140 | 28.0 | 5.7-10.9 | 1.1-2.0 | 57.1 | 2.6-2.9 | 15.1 |
| December | 8 | 165 | 20.6 | 5.6-12.6 | 1.2-2.9 | 41.7 | 1.9-2.9 | 14.3 |
| January | 7 | 188 | 26.9 | 7.4-11.5 | 3.0-4.3 | 70.0 | 1.7-2.8 | 19.6 |
| February | 7 | 189 | 27.0 | 6.1-9.1 | 1.3-2.1 | 60.0 | 1.3-1.3 | 14.8 |
| March | 4 | 113 | 28.3 | 4.2-8.1 | 0.0-1.8 | 0.0 | 1.1-2.8 | 9.6 |
Splits Stats - Ball control per game
| gp | off/g | def/g | reb/g | ast/g | to/g | stl/g | blk/g | |
|---|---|---|---|---|---|---|---|---|
| Event | ||||||||
| Total | 31 | 2.2 | 3.9 | 6.1 | 3.5 | 1.5 | 1.1 | 2.2 |
| Conference | 14 | 1.9 | 4.4 | 6.2 | 4.3 | 1.6 | 1.0 | 2.7 |
| Exhibition | - | - | - | - | - | - | - | - |
| Location | ||||||||
| Home | 13 | 2.3 | 4.0 | 6.3 | 4.0 | 1.5 | 1.2 | 2.2 |
| Away | 10 | 2.0 | 3.8 | 5.8 | 3.4 | 1.7 | 1.3 | 2.6 |
| Neutral | 8 | 2.3 | 3.9 | 6.1 | 2.6 | 1.3 | 0.8 | 1.6 |
| Result | ||||||||
| Wins | 26 | 2.2 | 4.0 | 6.3 | 3.8 | 1.5 | 1.1 | 2.3 |
| Losses | 5 | 2.0 | 3.2 | 5.2 | 1.8 | 1.6 | 1.2 | 1.4 |
| Month | ||||||||
| November | 5 | 3.2 | 3.0 | 6.2 | 2.6 | 1.6 | 1.8 | 2.4 |
| December | 8 | 2.0 | 3.5 | 5.5 | 3.1 | 1.4 | 1.0 | 1.5 |
| January | 7 | 2.1 | 3.3 | 5.4 | 3.4 | 1.6 | 1.4 | 2.9 |
| February | 7 | 1.6 | 5.4 | 7.0 | 5.1 | 1.7 | 0.6 | 2.6 |
| March | 4 | 2.5 | 4.3 | 6.8 | 2.3 | 1.0 | 1.0 | 1.3 |
Splits Stats - Ball control totals
| gp | gs | off | def | reb | ast | to | stl | blk | |
|---|---|---|---|---|---|---|---|---|---|
| Event | |||||||||
| Total | 31 | 29 | 68 | 121 | 189 | 107 | 46 | 35 | 67 |
| Conference | 14 | 14 | 26 | 61 | 87 | 60 | 23 | 14 | 38 |
| Exhibition | - | - | - | - | - | - | - | - | - |
| Location | |||||||||
| Home | 13 | 13 | 30 | 52 | 82 | 52 | 19 | 16 | 28 |
| Away | 10 | 8 | 20 | 38 | 58 | 34 | 17 | 13 | 26 |
| Neutral | 8 | 8 | 18 | 31 | 49 | 21 | 10 | 6 | 13 |
| Result | |||||||||
| Wins | 26 | 25 | 58 | 105 | 163 | 98 | 38 | 29 | 60 |
| Losses | 5 | 4 | 10 | 16 | 26 | 9 | 8 | 6 | 7 |
| Month | |||||||||
| November | 5 | 4 | 16 | 15 | 31 | 13 | 8 | 9 | 12 |
| December | 8 | 7 | 16 | 28 | 44 | 25 | 11 | 8 | 12 |
| January | 7 | 7 | 15 | 23 | 38 | 24 | 11 | 10 | 20 |
| February | 7 | 7 | 11 | 38 | 49 | 36 | 12 | 4 | 18 |
| March | 4 | 4 | 10 | 17 | 27 | 9 | 4 | 4 | 5 |
Splits Stats - Ball control per 40 min
| gp | off/40 | def/40 | reb/40 | ast/40 | to/40 | stl/40 | blk/40 | |
|---|---|---|---|---|---|---|---|---|
| Event | ||||||||
| Total | 31 | 3.4 | 6.1 | 9.5 | 5.4 | 2.3 | 1.8 | 3.4 |
| Conference | 14 | 2.8 | 6.5 | 9.2 | 6.4 | 2.4 | 1.5 | 4.0 |
| Exhibition | - | - | - | - | - | - | - | - |
| Location | ||||||||
| Home | 13 | 3.5 | 6.1 | 9.7 | 6.1 | 2.2 | 1.9 | 3.3 |
| Away | 10 | 3.1 | 5.8 | 8.9 | 5.2 | 2.6 | 2.0 | 4.0 |
| Neutral | 8 | 3.7 | 6.4 | 10.1 | 4.3 | 2.1 | 1.2 | 2.7 |
| Result | ||||||||
| Wins | 26 | 3.5 | 6.4 | 9.9 | 6.0 | 2.3 | 1.8 | 3.7 |
| Losses | 5 | 2.9 | 4.6 | 7.5 | 2.6 | 2.3 | 1.7 | 2.0 |
| Month | ||||||||
| November | 5 | 4.6 | 4.3 | 8.9 | 3.7 | 2.3 | 2.6 | 3.4 |
| December | 8 | 3.9 | 6.8 | 10.7 | 6.1 | 2.7 | 1.9 | 2.9 |
| January | 7 | 3.2 | 4.9 | 8.1 | 5.1 | 2.3 | 2.1 | 4.3 |
| February | 7 | 2.3 | 8.0 | 10.4 | 7.6 | 2.5 | 0.8 | 3.8 |
| March | 4 | 3.5 | 6.0 | 9.6 | 3.2 | 1.4 | 1.4 | 1.8 |
News Mentions


Giants land CVC men's basketball MVP, No. 3 NorCal playoff seed
February 28, 2022

Giants men's basketball rolling toward postseason winners of 11 straight
February 23, 2022

Giants bolster CVC men's basketball lead; travel to Merced next
February 3, 2022


COS men's basketball picks up pace while taking CVC lead
January 25, 2022
No. 14 Giants topple No. 3 Ventura for 5th straight men's basketball win
December 19, 2021